Everything you should know about Waterfall Analysis in a Cap Table
In today’s competitive business environment, maximizing profits requires careful consideration when determining product pricing. There is no longer a simple way for investors to determine their ROI by looking at their share of ownership. Nowadays, it’s incredibly simple for investors to miscalculate their returns due to the increasing complexity of term sheets.
To help you better understand your return in various exit situations and values, we have developed a tried-and-true, fully dynamic, integrated, and comprehensive model called “waterfall analysis.”
This article will explain everything you need to know about waterfall analysis in a cap table.
What Is Waterfall Analysis?
When conducting financial analysis, it is common practice to use a waterfall chart to illustrate how a net value is arrived at through the accumulation of gains and losses over time or the difference between actual and planned numbers.
Investors in a company are the primary users of the waterfall analysis financial model. However, people can also employ it when making major monetary choices.
A waterfall chart can also display cash flow changes or line items from an income statement. If the company were to be sold or liquidated, a waterfall analysis might be used to show how much money would be distributed to each stakeholder.
How Does Waterfall Analysis Work?
Waterfall analysis, a complex economic return modeling method, shows how exit revenues are distributed to a company’s many stakeholders. A waterfall analysis displays the sequential breakdown of a starting value to a final result by demonstrating intermediate values and ‘leakage’ points in the process. This can be done by beginning with one value and working your way to the end.
Businesses can use this to monitor data at every stage of the process. Two or more investors can utilize waterfall calculations to allocate cash flows among themselves according to predetermined return parameters.
What is a waterfall chart?
Storytelling is a method that has come into popularity as it makes data easier to understand and visualize. A unique kind of bar chart called a waterfall chart tells the story of the overall value shift between two points. Waterfall charts are more informative than traditional bar graphs because they break down the total change into its constituent parts and display them graphically.
Waterfall charts are useful for elucidating the underlying complexity of accumulated data. This chart is versatile enough to display data in sequential or category formats. Gains and losses are graphically represented by a sequence of bars, making it easy to see how events affect the initial value and ultimately lead to the final tally.
When the viewer needs to visualize both positive and negative growth, waterfall charts are an effective tool. It can also be used in any situation in which it is necessary to have an overview of the changes that have taken place. The purpose of a waterfall chart is to demonstrate the evolution of something through time, and it is an extremely useful tool for accomplishing this objective.
Why Do Businesses Need Waterfall Analysis?
Be it to explain a positive or negative outcome, businesses can benefit from using a waterfall analysis to illustrate the chain of causes and effects that led to it. The analysis can explain management and owners’ variations, outcomes, and differences. Rather than simply looking at the total earnings, a waterfall chart might assist you in identifying the source of that profit.
In many businesses, senior management prefers the waterfall-style of project management since it is structured and predictable. When and how a project will go to the next phase can be comprehended in a structured manner. Quantitative value changes over time are most effectively presented as a series of small percentage shifts. Managers like this since it makes communicating the project’s current status simple.
Equity Distribution With Waterfall Analysis And Cap Table
A capitalization table, or cap table, is a comprehensive breakdown of the ownership stakes of a corporation. The equity capitalization of a corporation is represented in a cap table by the various forms of equity represented therein, such as common equity shares, preferred equity shares, warrants, and convertible equity.
A capitalization table details the ownership and share percentages of a business. This can affect everything from the composition of the board of directors to the cost of subsequent investment rounds. Suppose you are the company’s founder and don’t have access to a cap table to consult. You could end up with much less than you bargained for if you give away a lot of stock in your company to employees or investors.
Each new fundraising round necessitates an updated cap table to reflect changes such as the issuance of extra shares of existing security, adjustments to employee stock option grants, and the issuance of new security shares.
When major shareholders depart, transfer shares to another current or new shareholder, or an employee is let go for any reason, the company must update the cap table to reflect these changes.
Waterfall analysis reveals the potential equity distribution in the event of a liquidity event to the various shareholders listed in the cap table. There is no way for shareholders to forecast when or how a liquidity event may occur.
Key Features You Should Consider In Waterfall Analysis And Cap Table-
The main features that concern waterfall analysis and cap table are:
1. Structure of Capital
Typically, a startup’s debt, convertible notes, preferred stock, and preferred warrants are all in front of the common shares and common options. Any exit waterfall model must consider the relative seniority of a business’s various stock and equity derivatives instruments, as well as the debt-to-equity ratio of the company.
2. Ownership rights
The returns of early-stage investors are very sensitive to various factors, including the type of liquidation preference, dividends, anti-dilution protection mechanism, conversion rights, acceleration of options, and other vesting requirements for options. Warrants, options, or other rights to subscribe for or purchase, or obligations to issue, any of the company’s equity interests, convertible securities, or stock appreciation rights, including any options or similar rights issued or issuable under any employee stock option plan or pension. In addition, any obligations to issue warrants, options, or other rights to subscribe for or purchase any of the company’s equity interests.
3. Exit Strategy
Compared to the analysis done for an initial public offering, the analysis done for a merger and acquisition exit scenario is considerably different. When a company issues its stock to the public for the first time, all of the preferred shares immediately convert into common stock, which means that liquidation preferences are rendered irrelevant. In contrast, the waterfall model is affected in various ways by the unique structures, lock-ups, and complexities of an initial public offering exit.
4. Equity and share types
A company’s total capital is divided into discrete parts of equal value. Simply put, a share is a proportion of ownership in a company or a financial asset denoted by a specific name for each unit. People who own shares in a corporation are the corporation’s shareholders. The right to receive dividend arrears belongs to cumulative stockholders and can be exercised before any dividend is paid to equity owners.
How To Use Exit Waterfall In The Cap Table?
The exit waterfall uses the capitalization table, which examines the distribution of profits to different classes of shareholders based on various liquidation preference structures, conversion situations, and the seniority of different share classes.
Companies can see how their profits break down across various exit values. This makes it easier to see the impact of the structures and the distribution to shareholders under a variety of different exit situations.
They can designate each preferred equity share class as either nonparticipating, fully participating, or participating with a cap. The model will automatically change the distribution of profits by these designations.
trica’s Cap Table Waterfall Analysis
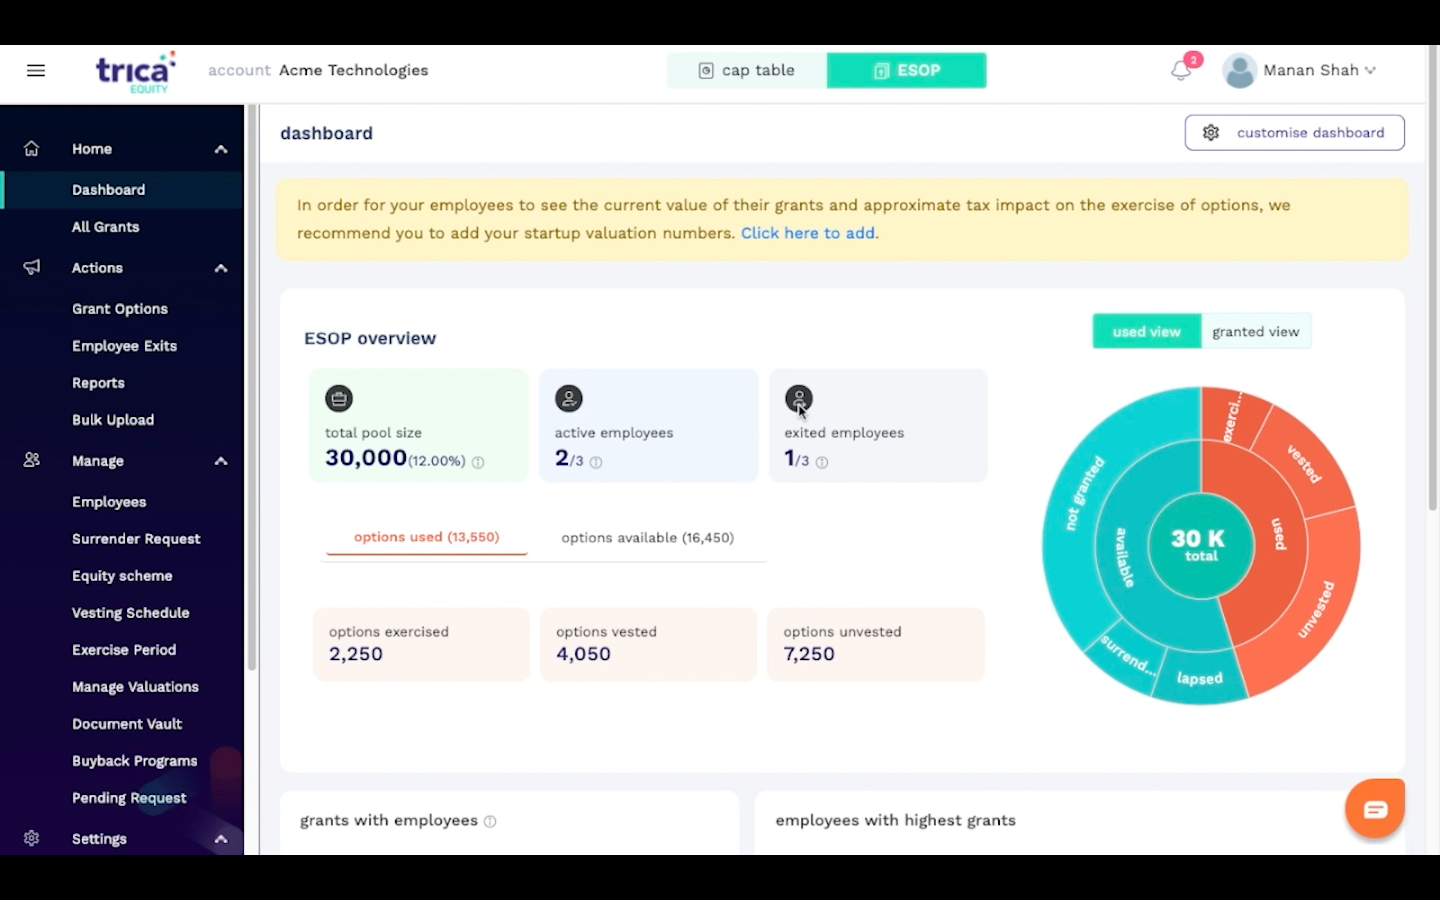
If your cap table is organized properly, you could attract hundreds of investors who could help you take your company to the next level. When tracking and managing their company shares, businesses use equity management software, also commonly referred to as cap table software in the business world. The features of trica’s cap table management software are that it becomes simple to analyze the cap table and identify potential exits for a company.
trica equity is a digital equity management solution that helps you keep track of your cap table and add new investors as your company expands. It also has tools for managing custom equity, creating valuation certificates, and adding additional layers of security with multi-factor authentication.
ESOP & CAP Table
Management simplified
Get started for free


